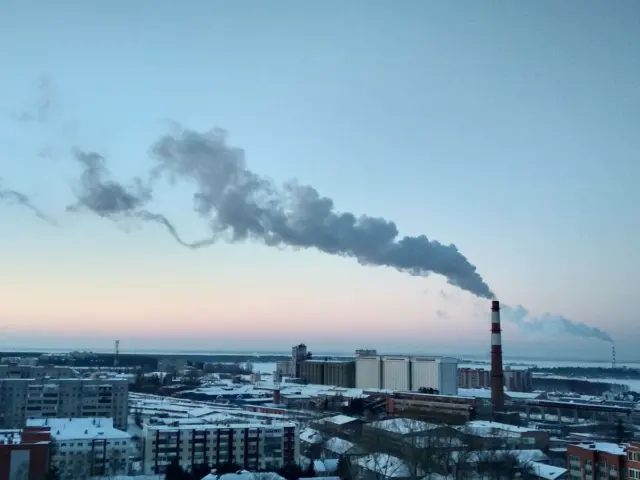

You may be wondering what is global warming and why people talk about it so much. It is the long-term rise in Earth’s average surface temperature, driven by heat-trapping greenhouse gases.
This guide is part of our look at climate change basics.
| Item | Value |
|---|---|
| Warming rate since 1850 | 0.11 °F (0.06 °C) per decade |
| Warming rate since 1975 | 0.36 °F (0.20 °C) per decade |
| 2024 versus the 1850-1900 average | 1.46 °C (2.63 °F) above |
| Warmest years on record | All ten fall in 2015-2024 |
| Carbon dioxide, latest NASA reading | 426 ppm (September 2026) |
These figures come from NOAA’s global temperature explainer (published May 2025) and NASA’s carbon dioxide page. They change as new data arrive, so check the sources before you rely on them.
What global warming actually means
Global warming is the rise in the average surface temperature of the whole planet over decades. It is not about one hot summer or one cold winter in your town.
Scientists measure it by combining land and ocean temperature records from around the world. They compare each year with a baseline, such as the pre-industrial period of 1850-1900 used by NOAA.
The idea is simple even if the measuring is not. A small change in the global average hides a large change in the energy held in the air, oceans and ice.
How greenhouse gases warm the planet
Sunlight warms Earth’s surface, and the surface sends some of that heat back toward space. Greenhouse gases slow that escape. NASA puts it plainly: “Greenhouse gases trap the heat from sunlight, warming the planet.”
Carbon dioxide is one of the best known of these gases. NASA’s latest reading was 426 ppm in September 2026, and its satellite-era graphics show carbon dioxide rising from 365 parts per million in 2002 to over 420 ppm in 2022.
Parts per million simply counts how many molecules of the gas sit among a million molecules of air. The more of the gas there is, the more heat stays in the system.
- Carbon dioxide: the gas NASA tracks as a key indicator of the planet’s health.
- Heat trapping: the shared property that makes a gas a greenhouse gas.
- Warming: the result when more heat is held than escapes.
What the temperature record shows
NOAA reports that 2024 was the warmest year since global records began in 1850. It was 1.46 °C above the pre-industrial average, according to the agency’s annual report as summarised in its May 2025 explainer.
The ten warmest years in that 175-year record have all occurred in the last decade, 2015-2024. That pattern is a trend, not a single spike.

The speed of change matters too. NOAA says the combined land and ocean temperature has warmed by 0.06 °C per decade since 1850, and more than three times that rate, 0.20 °C per decade, since 1975.
Why a small number is a big deal
A rise of roughly 1 °C can sound trivial, since daily temperatures swing far more. NOAA explains that the increase “might seem small, but it represents a significant increase in heat energy circulating through all parts of the Earth system.”
The oceans are a big reason. Because of their size and heat capacity, a huge amount of added heat is needed to raise the average surface temperature even slightly.
NOAA also notes that upper ocean heat content was the highest on record in 2024. The oceans, frozen landscapes and atmosphere all take part.
How scientists keep track
No single thermometer can tell us the temperature of a planet.
Because the raw numbers depend on where and how they were taken, scientists express the result as an anomaly. An anomaly is the difference from a chosen baseline, which makes places and years easy to compare.
Different agencies, including NOAA and NASA, build their own versions of the record. Their exact values differ slightly, but they tell the same overall story of a warming planet.
- Collect temperature readings from land and sea.
- Adjust for differences in instruments and locations.
- Convert each reading into a difference from the baseline.
- Average the results across the globe for each year.
Common misunderstandings
Because the topic is so widely discussed, a few mix-ups come up again and again. Clearing them up helps you read headlines with a calmer eye.
- “One cold day disproves it.” A single day or season is weather. Global warming is judged over many years and across the whole planet.
- “Every place warms equally.” Warming is an average. Some regions, seasons and times of day change more than others.
- “A small number cannot matter.” As explained above, the oceans, ice and air hold huge amounts of energy, so a small average shift reflects a large change.
- “It is a single-year story.” The record is about patterns over decades, not one unusual year.
Treating warming as a long-run average, rather than a daily forecast, is the key to understanding most of the debate you will hear.
Reading climate news with confidence
When a new figure appears in the news, a few quick questions help you judge it. Ask who produced the number, what baseline it uses and over what period it was measured.
Baselines matter a great deal. A figure measured against the 1850-1900 period is not directly comparable with one measured against the twentieth century, so two honest sources can quote different totals.
Look for the original agency page where possible, as with the NOAA and NASA pages linked above. Those pages also show their publication dates, which tells you how fresh the numbers are.
Finally, remember that records are updated. Each year adds a new data point, and past values are sometimes refined, so a figure quoted from an older page may have moved slightly.
Global warming versus related ideas
People often mix up several terms. Here is how they differ:
- Global warming: the rise in average global surface temperature.
- Climate change: the wider set of shifts that come with it, covered in our guide to climate change basics above.
- Weather: short-term conditions, which is why a cold day does not disprove warming. Our explainer on the difference between weather and climate unpacks this.
- Net zero: a goal for stopping further build-up of greenhouse gases; see what is net zero for the details.
Keeping these straight makes news about climate far easier to follow.
Frequently asked questions
Is global warming the same as climate change?
Show answer
Not exactly. Global warming describes the rise in average temperature, while climate change covers all the resulting shifts in the climate system.
Why does it still get cold in winter?
Show answer
Winter cold is weather, a short-term event. Global warming is a long-term average, so cold days still happen even as the ten warmest years cluster in 2015-2024.
How fast is the planet warming?
Show answer
Per NOAA’s May 2025 explainer, the long-term rate since 1850 is 0.06 °C per decade, and the rate since 1975 is 0.20 °C per decade.
Which gas is most often tracked?
Show answer
NASA tracks carbon dioxide as a key greenhouse gas indicator. Its latest reading was 426 ppm in September 2026.